
3 White Soldiers Pattern: What it is and how to use it?

 Prefer us on Google
The cryptocurrency market's notorious volatility makes technical analysis an essential skill for traders. Among various chart patterns, the Three White Soldiers stands out as a particularly reliable bullish reversal indicator. This triple-candle formation typically emerges at the end of downtrends, signaling strong buying pressure and potential trend reversal, making it invaluable for timing entry points in volatile crypto markets.
What Is the 3 White Soldier Pattern?
The three white soldiers pattern is a bullish reversal pattern formed by three consecutive candles, which are green (or white) in color. This pattern forms at the bottom of a downtrend and all three candles are long and bullish.
It is often used as a reversal signal out of a bear market or a downtrend since that creates the best risk/reward ratio.
The candles are almost the same length and the open of each candle is above the open of the previous candle. It signals an upcoming uptrend because of the strong buying pressure.
This pattern is also known as “three advancing soldiers” because of the fact that it indicates the end of a downtrend and marks a clear indication in the balance shift from sellers to buyers.
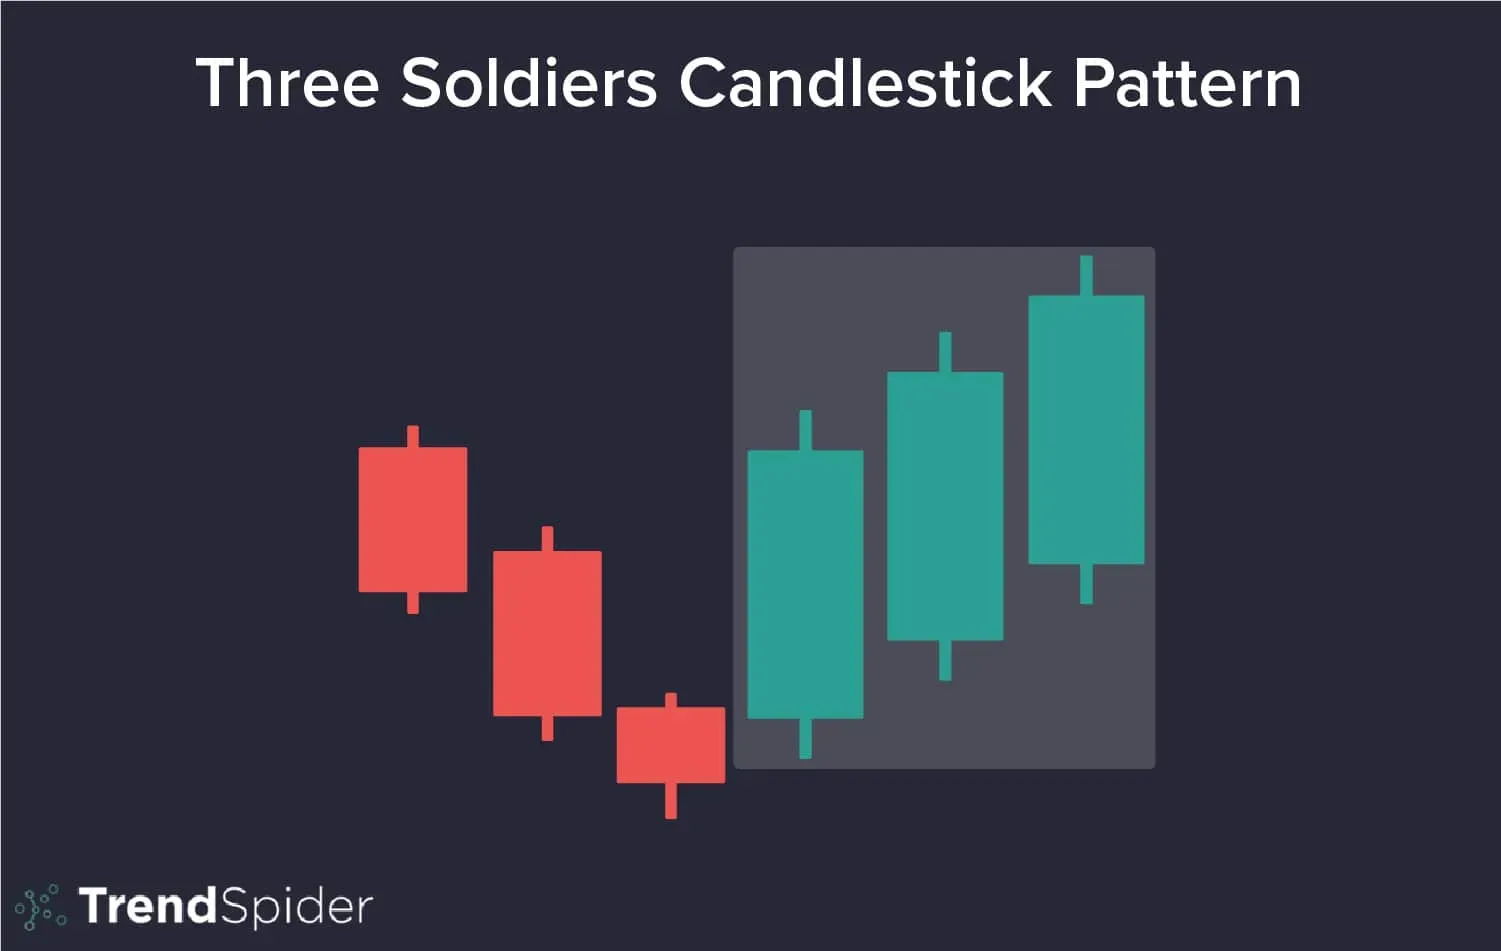
Source: TrendSpider
Why Is It Important for Traders?
The Strategic Value of 3 White Soldiers Pattern
This powerful bullish reversal pattern emerges at the end of downtrends, serving as a critical indicator for traders. Its formation signals strong buying pressure overcoming selling momentum, providing dual utility: it alerts short sellers to exit positions while offering long traders a strategic entry point to capitalize on the impending uptrend.
Practical Trading Applications
Beyond simply identifying trend reversals, the Three White Soldiers pattern enables traders to gauge market sentiment shifts and time their positions accordingly. Its appearance after sustained declines presents opportunities to either close short positions profitably or initiate new long positions aligned with the emerging bullish momentum.
How To Recognize the Pattern on Charts?
The 3 White Soldiers pattern is most reliably identified at the end of extended bearish trends, serving as a clear reversal indicator. Traders should first confirm the presence of a swing low price point, followed by three consecutively higher closing candles where each session closes above the previous candle's high.
Key Validation Criteria
• Established downward price movement preceding the pattern
• Three progressively larger bullish candles forming at trend bottom
• Ascending staircase formation with minimal/no upper wicks
• Each candle must close above the prior candle's high
• Supporting volume increase strengthens signal validity
-- Price
Final Thoughts
The 3 white soldiers pattern is a powerful tool for identifying bullish reversals across markets. Understanding 3 candlestick patterns like the three white soldiers in stock, forex, commodity, and cryptocurrency* trading can provide an edge; however, be sure to confirm signals with additional analysis to improve accuracy.
This content is provided for general informational purposes only and doesn't constitute financial, investment, legal, or tax advice. Any events, rewards, online promotions, or related information mentioned herein should not be considered a recommendation, solicitation, or invitation to purchase, sell, trade, or otherwise deal in any crypto assets. Crypto assets are highly volatile and may result in loss. The availability of WEEX services, products, and related events may vary by region. You are responsible for ensuring that your participation is in accordance with applicable local laws and regulations.
You may also like

4 (FOUR) Token Price Prediction 2025-2030

What is Cryptocurrency Day Trading?

Dogecoin Price Prediction: What's Next for Dogecoin?

User Guide: What Are Perpetual Futures Contracts?
What Is a Bull Market?

Hammer Candlestick: What it is and how to use it?

Bullish Candlestick Pattern

Bearish Candlestick Patterns

What Is MACD indicator?
What Is Relative Strength Index?

How to Read the Most Popular Candlestick Patterns?
How to Trade Futures on WEEX: A Complete Guide for Beginners

Micron (MU) Earnings Date: When Q4 FY2026 Reports and What to Watch
Oracle (ORCL) Earnings Date: When Q1 FY2027 Reports and What to Watch

NVIDIA (NVDA) Earnings Date: When Q2 FY2027 Reports and What to Watch

BitMEX Is Closing September 23, 2026: Timeline and How to Withdraw Before the Deadline

Micron Stock (MU): Price, Outlook and How to Buy
How to Log In to MetaMask: Unlock, Troubleshooting and Recovery (2026)
SanDisk Stock (SNDK): Price, Outlook and How to Buy
Bybit Japan Service Termination: The Complete Timeline and What Happens on July 22, 2026
Bitcoin Price Over 10 Years: Historical Recap and Long-Horizon Outlook
BitMart Is Closing: Shutdown Timeline and How to Withdraw Before August 26, 2026
SOXSB Explained: Why the 3x Chip Bear ETF Resets Without You
CLARITY Act: What Happens in the Senate's September Window

How to Call a Crypto Exchange API Without Getting Blocked
Crypto Exchange API: Permissions, Signing and Rate Limits

QQQB and the Fed: What the FOMC Minutes Mean for Nasdaq-100
How to Trade Unitree Stock When You Can't Buy 688836
ETH to USDT: What the Converter Rate Leaves Out
Your Crypto Exchange Is Shutting Down: How to Move Your Funds and Choose the Next Exchange





